


SINGAPORE'S TEMASEK HOLDINGS’ CONTROL MECHANISMS AND THE PERFORMANCE OF THE FIRMS CONTROLLED BY TEMASEK

1Kerry Liu is an economist from a major international bank in Sydney, Australia
ABSTRACT
This paper examines the control mechanisms of Singapore's Temasek Holdings and the performance of the firms controlled by Temasek. The data were hand-collected from a wide range of data sources and the sample period consists of five years. Ordinary Least Squares regression analysis is applied with Huber-White standard errors. This study finds that Temasek Holdings adopts a series of control mechanism, and these mechanisms destroy valuation. This paper also finds that Temasek Holdings’ listed block investments in non-Singapore regions have consistently underperformed those based in Singapore during 2004-08. This study is the first to provide detailed analysis on the control mechanisms employed by Temasek Holdings, and the effect of these mechanisms on performance.
© 2017 AESS Publications. All Rights Reserved.
Keywords: Sovereign wealth fund, Temasek holdings, Control mechanism, Singapore, Pyramiding structure, Block investments
JEL Classification: G3.
Received: 1 September 2016/ Revised: 5 November 2016/ Accepted: 9 November 2016/ Published: 14 November 2016
Contribution/ Originality
This study is the first to investigate the control mechanisms of Singapore's Temasek Holdings and the effect of these mechanisms on performance.
1. INTRODUCTION
Sovereign Wealth Funds (SWFs) have been operating in the financial markets for a long time such as the Kuwait Investment Authority was incorporated in 1953. It attracted the attention of global finance markets only since 2006 when these SWFs made a few investments in the trouble financial institutions1
. Temasek Holdings (“Temasek”) is one of the biggest and most transparent. Study on Temasek can provide a rare opportunity to have a look at the inside of these funds. First, a brief introduction on Temasek is presented including its block investments (defined as an investment Temasek holds at least 20% ownership), the significance of this study on Temasek and a literature review. Then this paper explores a few questions concerning the block investments made by Temasek. They include: how Temasek controls these investments or the control mechanism of Temasek; how Temasek’s investments perform; whether Temasek’s investments are politically motivated.
2. TEMASEK HOLDINGS
2.1. Background
Temasek was incorporated in 1974 as a limited liability exempt private company to hold equity investments previously held directly by the Ministry of Finance, Singapore. Under the Companies Act of Singapore, an exempt private company is defined as a private company which shares are not held directly or indirectly by any corporation and which has not more than 20 shareholders. As an exempt private company, Temasek is not required to publish its financial accounts. In order to raise debt, Temasek reported its accounts to the public for the first time in its 30-year history on October 12 2004. Since then, Temasek has had an overall corporate credit rating of “Aaa” by Moody’s and “AAA” by Standard & Poor’s. Temasek manages a large portfolio, which spans various industries. The portfolio value during FY2004-2008 2
is shown below. The calculations are based on market value of listed assets and book value for unlisted assets less debt.
Table-1. Portfolio value managed by Temasek during FY2004-2008
| 2004 | 2005 | 2006 | 2007 | 2008 | |
| Total Portfolio value ($ billion) | 62.4 | 79.8 | 108.1 | 134.2 | 85.5 |
| fraction of listed block investments | 68% | 57% | 52% | 48% | 38% |
| Portfolio value of listed block investments ($ billion) | 42.4 | 45.5 | 56.2 | 64.4 | 32.5 |
Data source: Temasek Holdings annual reviews
This paper only covers the listed block investments made by Temasek. Its portfolio value varies from 32.5 $b in FY2008 to 64.4 $b in FY2007.
The appointment, re-appointment or removal of the Board members and / or CEO is subject to the approval of the Elected President of the Republic of Singapore. Being different from the Government of Singapore Investment Corporation, Temasek does not manage the reserves of the Singapore Government.
It adopts a direct investment and public market investments. The firms investigated in this paper are from either Temasek’s direct investments or assets previously held by the Ministry of Finance, Singapore.
2.2. The Block Investments Made By Temasek
The methodology of calculating cash flow rights and control rights from Faccio and Lang (2002) is adopted. Cash flow rights are defined as the fraction of the firm’s ultimate cash-flow rights, if any, owned by its controlling shareholder. Cash flow rights are computed as the product of all the equity stakes along the control chain. Control rights is defined as the fraction of the firm’s voting rights, if any, owned by its controlling shareholder. To measure control, they combine a shareholder’s direct (i.e., through shares registered in her name) and indirect name (i.e., through shares held by entities that, in turn, she control) voting rights. For example, if a family owns 15 percent of Firm X, which owns 20 percent of Firm Y, and family also owns 7 percent of Firm Y directly, then the family owns 10 percent of the cash flow rights of Firm Y (0.15 * 0.20 + 0.07) and controls 22 percent of its voting rights (min (0.15, 0.20) + 0.07).If following the criteria of 20% control rights as being in control adopted by La Porta et al. (2002) there are 46 sample firms. Merrill Lynch and Standard Chartered are excluded. The following Table 2 shows the cash flow rights and voting rights of listed firms where Temasek is the largest shareholder.
Table-2. Listed Firms where Temasek is the Largest Shareholder
| 2004 | 2005 | 2006 | 2007 | 2008 | ||||||
| Name | Cash Flow Rights | Voting Rights | Cash Flow Rights | Voting Rights | Cash Flow Rights | Voting Rights | Cash Flow Rights | Voting Rights | Cash Flow Rights | Voting Rights |
| Global Crossing | 61% | 29% | 58% | 27% | 73% | 66% | 64% | 53% | 62% | 51% |
| PT Indosat | 41% | 41% | 41% | 41% | 41% | 41% | 31% | 41% | ||
| Equinix | 35% | 35% | ||||||||
| StarHub | 63% | 63% | 57% | 57% | 57% | 57% | 44% | 57% | 44% | 57% |
| Singapore Telecommunication | 63% | 63% | 56% | 56% | 56% | 56% | 55% | 55% | 55% | 55% |
| Globe Telecom | 28% | 48% | 27% | 48% | 25% | 48% | 24% | 48% | 24% | 48% |
| Singapore Post | 20% | 31% | 15% | 27% | 15% | 26% | 14% | 26% | 14% | 26% |
| Bharti Airtel | 17% | 48% | 17% | 48% | 17% | 48% | 17% | 48% | ||
| Shin Corporation | 49% | 49% | 93% | 96% | 93% | 96% | 93% | 96% | ||
| Advanced Info Service | 33% | 64% | 52% | 64% | 52% | 64% | 51% | 64% | ||
| CS LoxInfo | 16% | 53% | 23% | 53% | 23% | 53% | 23% | 53% | ||
| Thaicom PLC | 38% | 41% | ||||||||
| DBS Group Holdings | 28% | 28% | 27% | 27% | 28% | 28% | 28% | 28% | 28% | 28% |
| PT Bank Danamon | 56% | 66% | 59% | 69% | 59% | 69% | 58% | 68% | 58% | 68% |
| PT Bank International Indonesia | 35% | 35% | 35% | 35% | 37% | 37% | 48% | 48% | ||
| NDLC-IFIC Bank (NIB) | 73% | 73% | 72% | 72% | 71% | 71% | 71% | 71% | ||
| Merrill Lynch | 9% | 9% | ||||||||
| Standard Chartered | 19% | 19% | 19% | 19% | ||||||
| Capital Land | 59% | 59% | 42% | 42% | 40% | 40% | 40% | 40% | 40% | 40% |
| Australand | 32% | 55% | 22% | 42% | 22% | 40% | 22% | 40% | 24% | 40% |
| Ascott Group | 40% | 59% | 29% | 42% | 27% | 40% | 39% | 40% | ||
| Raffles Holding | 35% | 59% | 25% | 42% | ||||||
| Societe Montreux Palace | 29% | 59% | ||||||||
| Ascott Residential Trust | 24% | 40% | 18% | 40% | 19% | 40% | ||||
| CapitaRetail China Trust | 10% | 26% | 10% | 26% | 11% | 27% | ||||
| CapitaCommercial Trust | 24% | 40% | 16% | 37% | 12% | 30% | 12% | 31% | 12% | 31% |
| CapitaMall Trust | 23% | 39% | 14% | 34% | 12% | 31% | 12% | 29% | 12% | 40% |
| Keppel Corporation | 31% | 31% | 32% | 32% | 21% | 21% | 21% | 21% | 21% | 21% |
| Keppel Land | 17% | 31% | 17% | 32% | 11% | 21% | 11% | 21% | 11% | 21% |
| Keppel Thai Properties | 9% | 31% | 9% | 32% | 5% | 21% | 5% | 21% | 5% | 21% |
| Dragon Land | 4% | 25% | 12% | 32% | 8% | 21% | 8% | 21% | 9% | 21% |
| Keppel Philippine Properties | 16% | 31% | 16% | 32% | 11% | 21% | 12% | 21% | 12% | 21% |
| Keppel Philippine Marine | 18% | 31% | 19% | 32% | 17% | 21% | 20% | 21% | 20% | 21% | Keppel Telecommunications & Transport | 25% | 31% | 26% | 32% | 17% | 21% | 17% | 21% | 17% | 21% |
| Singapore Petroleum | 15% | 31% | 14% | 32% | 9% | 21% | 9% | 21% | 9% | 21% |
| K1 Ventures | 11% | 31% | 12% | 32% | 8% | 21% | 8% | 21% | 8% | 21% |
| Sembcorp Industries Limited | 51% | 51% | 51% | 51% | 49% | 49% | 49% | 49% | 49% | 49% |
| Sembcorp Marine Limited | 32% | 51% | 32% | 51% | 30% | 49% | 30% | 49% | 30% | 49% |
| SembCorp Logistics Limited | 31% | 51% | 31% | 51% | ||||||
| Singapore Technologies Engineering | 55% | 55% | 55% | 55% | 55% | 55% | 50% | 50% | 50% | 50% |
| Chartered Semiconductor Manufacturing | 60% | 60% | 60% | 60% | 60% | 60% | 59% | 59% | 59% | 59% |
| STATS ChipPAC | 36% | 36% | 36% | 36% | 35% | 35% | 83% | 83% | 84% | 84% |
| STATS ChipPAC Taiwan Semiconductor | 18% | 36% | 18% | 36% | 18% | 35% | 42% | 51% | 43% | 51% |
| Singapore Airlines | 57% | 57% | 57% | 57% | 55% | 55% | 54% | 54% | 55% | 55% |
| Neptune Orient Lines Limited | 67% | 67% | 67% | 67% | 66% | 66% | 66% | 66% | 66% | 66% |
| SMRT Corporation | 62% | 62% | 62% | 62% | 55% | 55% | 54% | 54% | 54% | 54% |
| Singapore Food Industries | 71% | 71% | 71% | 71% | 70% | 70% | 70% | 70% | ||
| SP Ausnet | 51% | 51% | 51% | 51% | 51% | 51% | ||||
Data source: Temasek Holdings annual reviews and annual reports of relevant companies
2.3. The Significance of the Study on Temasek
There are a few reasons why the study on Temasek is important.
Firstly, Temasek plays a dominant role in the Singapore Exchange (“SGX”). Temasek is an important Singaporean investment arm. Temasek-controlled firms, which are listed on the Singapore Exchange, account for around 30% of the total market capitalization of SGX. One single company shareholder controlling such a high fraction of one stock market is rarely heard in other developed markets 3
The following Table 3 shows the status of Temasek in Singapore economy and in the SGX.
Table-3. The Status of Temasek in Singapore Economy and in the SGX
| Year | 2004 | 2005 | 2006 | 2007 | 2008 |
| Temasek-controlled firms' market cap over total market cap of SGX | 30.6% | 30.2% | 33.7% | 27.3% | 29.0% |
| Temasek’s Portfolio Value over GDP of Singapore | 56.9% | 65.8% | 76.9% | 78.2% | 45.4% |
Data source: SGX, Singapore Department of Statistics, and the World Federation of Exchanges (www.world-exchanges.org), an association of 53 regulated exchanges around the world providing annual, YTD and statistics.
Note: the market capitalization of Temasek-controlled firms is underestimated since a few data items' value is missing. For dual-listed firms, only their SGX parts are included.
Secondly, Temasek and other SWFs have attracted the attention of international financial institutions such as the International Monetary Fund (IMF) and of Western governments4 , and been the subjects of world headlines since 2006. The most controversial issue about SWFs is their transparency and accountability. As Devlin and Brummitt (2007) augured that “The typical SWF does not publicly disclose much substantive information on its asset allocation approach, the size (and type) of its individual holdings or its investment returns, nor its corporate governance processes or risk management techniques”. Some statesmen have expressed concerns over the potential effect on host countries. The economist Larry Summers (the former US Treasury secretary and former president of Harvard University) worried about the particular risks associated with ownership by government-controlled entities, particularly where the ownership stake is taken through direct investments. The Bush administration was pressing the IMF and the World Bank to examine the behavior of these funds and to develop possible codes of conduct for SWFs 5. In Germany, where there was concern about Russia buying pipelines and energy infrastructure and squeezing Europe for political gain, Chancellor Angela Merkel had warned that purchases by foreign governments or government-controlled companies could pose a risk. The European Union was also planning to set up a code of conduct governing the investment activities of SWFs 6. On February 19, 2008, the Australian government announced six principles governing foreign investments in Australian companies. In Oct 2008, the IMF worked out the generally accepted principals and practices for SWFs namely “Santiago Principals”. To examine the investments of one individual SWF – Temasek and see how it controls these investments is critical for regulatory authorities.
Thirdly, Temasek is one of the very few SWFs which adopt concentrated equity investment strategy. Most of the investments made by other SWFs are taking the form of portfolio and rarely amount to a control stake holding (Balding, 2008). The China Investment Corporation (CIC) is the other one who claims that it also adopts concentrated equity investment strategy7 . However, CIC rarely have a controlling stake in its investments except the four Chinese banks which shares were previously held by the Ministry of Finance of China before 2007.
2.4. Literature Review
There are three streams of literature review.
First, it is about the definition of SWF. According to Balding (2008) A SWF is a pool of capital controlled by a government or government related entity that invests in assets seeking returns above the risk free rate of return. The IMF states that SWFs are special investment funds created or owned by government to hold foreign assets for long term purposes. Blundell-Wignall et al. (2008) state that SWFs are pools of assets owned and managed directly or indirectly by governments to achieve national objectives. Morgan Stanley’s Jen (2007) defines a SWF as a government investment vehicle which is funded by foreign exchange assets, and which manages these assets separately from official reserves. The above several authors define SWFs from a quite narrow angle. They either focus on SWF’s special purpose or SWF’s source of fund.
Second, previous studies on SWFs (Chhaochharia and Laeven, 2008); (Veljko et al., 2008) employed event studies concluding that the long-run performance of equity investments by SWFs tended to be poor. The main concern about these studies is the data problem. As SWFs did not publish regular financial statements or disclose the contents of their portfolios, it is not convincing to conclude their investment properties only based on a limited number of observations.
Third, there are very few studies on Temasek. Heaney et al. (2011) examined the investment decisions of Temasek and found that Temasek has a predisposition to invest in firms that are relatively large and have few director block holders. They leave the issues of how Temasek controls its Investments and the effects on corporate performance unanswered. Anga and King (2006) simply concluded that government-linked firms in Singapore outperform private firms.
3. THE CONTROL MECHANISM OF TEMASEK
Temasek adopts a series of tools to maintain and enhance its control over its investments in listed firms. They are called “control-enhancing tools”. Some of these tools or strategies mentioned below are not mutually exclusive.
A, being in absolute control
Temasek is the absolutely controlling shareholder in a large fraction of its block investments in listed companies. Here “Absolute Control” is defined as Temasek holds at least 50% control rights. The following Table 4 shows the fraction of firms under absolute control of Temasek during FY2004-2008.
Table-4. The fraction of firms under absolute control of Temasek during FY2004-2008
| Year | 2004 | 2005 | 2006 | 2007 | 2008 |
| fraction | 45.9% | 35.0% | 36.6% | 39.5% | 41.0% |
Source: annual reports
B, pyramiding structure
Besides in absolute control, Temasek also adopts pyramiding structure as one of its control mechanisms. Firm Y is said to be controlled through “pyramiding” if it has an ultimate owner, who controls Y indirectly through another corporation that it does not wholly control. For example, if a family owns 20 percent of Firm X, which owns 30 percent of Firm Y, then Y is controlled through a pyramid at the 20 percent threshold. The following Figure 1 shows the pyramiding structure8
of Temasek in FY 2004.
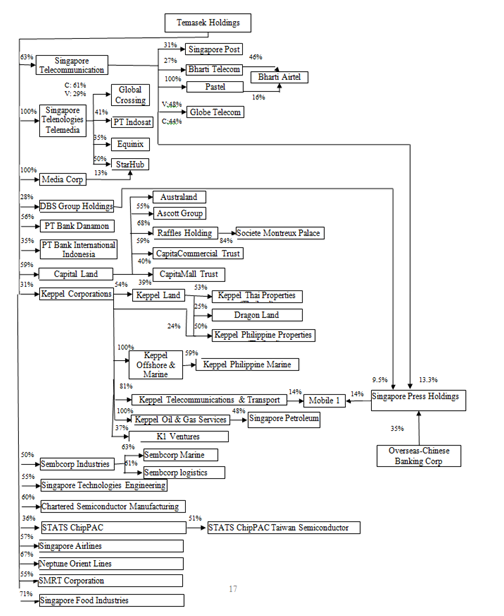
Figure-1. Pyramiding Structure of Temasek
Source: annual reports.
Note: C means cash flow rights. V means voting rights or control rights. If not otherwise specified, cash flow rights are assumed to be equal control rights.
This pyramiding structure creates the discrepancy between cash flow rights and control rights. Table 1 shows the difference between control rights and cash flow rights for the firms controlled by Temasek during FY2004-2008. The following Table 5 shows the average ratio of control rights to cash flow rights during FY2004-2008.
Table-5. The average ratio of control rights to cash flow rights during FY2004-2008
| Year | 2004 | 2005 | 2006 | 2007 | 2008 |
| Ratio | 1.55 | 1.59 | 1.57 | 1.54 | 1.59 |
Source: annual reports
C, Golden Share
Golden shares are those which give the Singaporean government the authority to outvote all other shares in certain specified circumstances including changing a company’s charter. Singaporean government has abandoned its golden shareholding in Singapore Telecom, but still holds a special share in Singapore Airlines via the Ministry of Finance although Temasek is already the absolutely controlling shareholder. It claims that “the company must be at all time being ‘effectively controlled’ and ‘substantially owned’ by Singapore nationals” 9 . During the tensions between Singapore Airlines and its pilots, the Minister Mentor Lee Kuan Yew personally got involved10 and warned the airline to cut costs 11 although Temasek said “we did not involve ourselves in their commercial or operational decisions 12”.
D, To Increase Ownership in Parent Company
Through this strategy, Temasek at the beginning is not the largest shareholder (directly or indirectly through its controlled entity) but then increases its stake in the parent company of its target firm. Finally, Temasek is in control of the target firm by combining its direct and indirect holdings.
The following Figure 2 shows such an example.
A: as of 31 Mar 2005
B: as of 31 Mar 2006
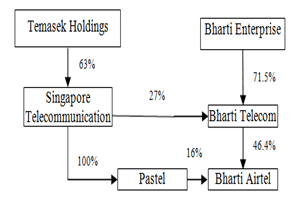
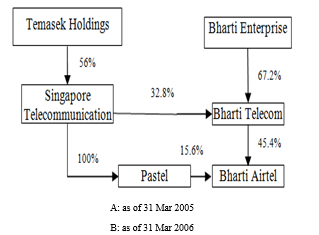
Figure-2. The Changing Ownership Structure of Bharti Airtel
Source: annual reports
As of 31 Mar 2005, Temasek’s controlled entity Singapore Telecom held directly 16% and indirectly 12.5% (=27%*46.4%) cash flow rights through the parent company Bharti Telecom in Bharti Airtel. Temasek’s total cash flow rights were 18% (= (16%+12.5%)*63%) and control rights were 43% (=MIN (0.63, 0.16+MIN (0.27, 0.464))). Bharti Enterprise’s cash flow rights and control rights were separately 33% (=71.5%*46.4%) and 46.4% (=min (71.5%, 46.4%)). Temasek was the second largest shareholder behind Bharti Enterprise in 2005.
After that, Temasek decreased its stake in Singapore Telecom and Bharti Airtel (through Singapore Telecom) but slightly increased its stake in the parent company Bharti Telecom through Singapore Telecom to 32.8% from previous 27%. This slight change of Temasek’s ownership (through Singapore Telecom) in the parent company Bharti Telecom did mean a lot. Temasek’s total cash flow rights were 17.1% (= (15.6%+32.8%*45.4%)*56%) and control rights were 48.4% (=MIN (0.56, 0.156+MIN (0.32.8, 0.454))). Bharti Enterprise’s cash flow rights and control rights were separately 30.5% (=67.2%*45.4%) and 45.4% (=min (67.2%, 45.4%)). Temasek then became the largest shareholder in terms of control rights although its cash flow rights had decreased. This ownership structure was stable until 31 Mar 2009.
Temasek also used this strategy to become the largest shareholder of Advanced Info Service and CS LoxInfo after acquiring a large amount of the shares of their parent company Shin Corporation (further discussion will be undertaken in Section F “Use of Nominees”).
E, Influence on a Third Party
In this case, Temasek maintains its control not just through ownership but also through its close relationship with the related company’s management and the board. The following Figure 3 shows a possible example.
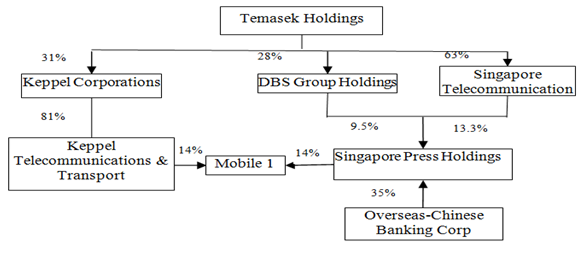
Figure-3. The Ownership Structure of Mobile 1 (as of 31 March 2005) 13
Source: annual reports
From the above figure, we can see that Keppel Corporations through Keppel Telecommunications & Transport holds 14% stakes in Mobile 1 as the largest shareholder. Singapore Press Holdings (SPH), which largest shareholder is Overseas-Chinese Banking Corporation, also holds 14% shares. At this point, we cannot conclude that Temasek is in control of Mobile 1. However, things are different in fact.
Firstly, SPH is under regulation of the Newspaper and Printing Presses Act14 in Singapore. As specified by the Act, like other newspaper companies, SPH is required to issue both management and ordinary shares and all issues and transfers of management shares have to be approved by the Minister of the Information, Communications and the Arts. In "any resolution relating to the appointment or dismissal of a director or any member of the staff" (PART III, 10(11)), the vote of one management share is equivalent to 200 ordinary shares.
Secondly, there are close ties between the directors of SPH and the Singapore Government. S. R. Nathan, who served as SPH’s executive chairman from 1982 to 1988, was the director of Security and Intelligence Division and later President of Singapore. Tjong Yik Min, who was the president of SPH during 1995-2002, was the former chief of the Internal Security Department of Singapore. The present chairman of SPH, Tony Tan, was Deputy Prime Minister of Singapore from 1995 to 2005 15.
As of 31 Mar 2006, Telekom Malaysia Berhad acquired 25.17% shares in Mobile 1. The total cash flow rights (control rights) of Keppel Telecom and Transport (an entity controlled by Temasek) and SPH are 28%. If combining the equity stakes held by both Keppel Telecom and Transport and SPH, they will be the largest shareholder and in de facto control of Mobile 1. During the next three years, this ownership structure remains stable (see Table 6).
Table-6. The Cash Flow / Control Rights of the Top 3 Large Shareholders of Mobile 1
| Mar 2007 | Mar 2008 | Mar 2009 | |
| Keppel Telecom and Transport (KTT) | 17.1% | 19.0% | 20.0% |
| Singapore Press Holdings | 17.0% | 13.9% | 13.9% |
| Combined stakes of KTT and SPH | 34.10% | 32.96% | 33.90% |
| Telekom Malaysia Berhad | 29.8% | 29.7% | 29.7% |
Source: annual reports
F, Use of Nominees
This mechanism is applied especially by Temasek when investing in foreign countries. A few investments in foreign countries made by Temasek are controversial. Of particular was Temasek’s acquisition of Shin Corporation, which was owned by the family of then Thai Prime Minister, in 2006. The deal exacerbated the Thai political crisis and eventually led to the step-down of the Thai Prime Minister16
. The following Figure 4 demonstrates such a case.

Figure-4. Use of Nominees in Enhancing Control: the Case of Shin Corporation (As of 31 Dec 2006)
Source: annual reports
From the above Figure 4, we can see that the Temasek’s cash flow rights in total over Shin Corporation were 75.8% (=41.8%+(48.9%+29.9%*45.2%)*54.5%) and control rights were 41.8% (the Cypress link was not considered since Cypress was not the largest shareholder of Cedar, which owned a majority stake in Shin Corporation). In fact, the controversial point was the identity of the individual controlling shareholder of Kularb Kaew, Mr. Surin Upatkoon. Kularb Kaew was defined as a nominee company according to the revised Foreign Business Act of Thailand17 and Mr. Surin Upatkoon was a nominee of Temasek18 .
If considering Mr. Surin Upatkoon as a nominee of Temasek, Temasek then held 92.6% (=41.8%+(48.9%+(29.9%+68%)*45.2%)*54.5%) cash flow rights and 87% (=41.8%+MIN(MIN((29.9%+68%),45.2%), 48.9%, 54.5%)) control rights in Shin Corporation.
4. THE PERFORMANCE OF THE FIRMS CONTROLLED BY TEMASEK
In this section, a series of regressions are undertaken to study the performance of the companies controlled by Temasek. The sample firms are all included in Table 2.
4.1. Data
4.1.1. Data Sources
No single data base provides all required information of these companies. The majority of the data items were manually collected from a varity of sources. The following Table 7 provides data sources in detail.
Table-7. Data Sources
| Data Item | Sources |
| cash flow rights and voting rights | Temasek 05, 06,07,08,09 Annual Reviews; Annual Reports; internet sources including: firm websites, news reports and Wikipedia |
| Industry Classification | Bloomberg |
| Stock Price | Bloomberg; Annual Reports; Emerging Markets Data Base (EMDB) Daily Stock File (inactive stock); Yahoo Finance; Financial Times Market Data |
| Number of common shares issued | Annual Reports; Compustat Global Industrial/Commercial (Compustat Global- Fundamentals Annual) |
| Financial Information | Annual Reports; Google Finance; Compustat Global Industrial/Commercial ; Compustat North America (note: In most cases, the earnings before interest and tax information is not directly reported, then they are manually collected and calculated from Annual Reports |
| Exchange Rate | Singapore Dollar and US Dollar, Monetary Authority of Singapore; Australia Dollar and US Dollar, Reserve Bank of Australia; HK Dollar and US Dollar, Hong Kong Monetary Authority, |
| Dragon Land | FY2004 and FY2005 data are from OSIRIS, FY2006, FY2007 and FY2008 data are not available |
4.1.2. Performance Measures
Empirical studies often examine Tobin’s Q as performance measure. The numerator of Q is the year-end market value of common stock, and the book value of preferred stock and debt. The denominator is year-end book value of its total assets. The methodology was also adopted by Demsetz and Villalonga (2001).
The other variable to measure firm performance is accounting rate of return, of particular is Return on Asset (ROA). It is defined as net earnings after interest expenses and taxes /asset. The issue is that the entire sample firms are controlled by one ultimate shareholder, Temasek. It is possible and quite likely that the top management of Temasek may implement internal transactions among Temasek-linked firms. The pricing of these transactions may not be necessarily market-based. Accordingly, the accounting rates of return may not be what they should be.
Furthermore, since this study is concerned about the performance of the companies controlled by Temasek from the viewpoint of investors, the Q measure will be more appropriate.
4.1.3. Control Variables
Since the number of sample data sets is limited (just less than 200), if too many control variables are added, data sets would be too few for some categories. The results of regression analysis will be less reliable. It is possible then that R-Square will become high. However, this “high” R-Square is possibly artificially since some independent variables’ variations explain just small parts of the variance of the dependent.
Most of the regressions are with fixed effects. Nine country dummy variables and four year dummy variables are included in most of the regressions. For some cases which have many independent variables, an alternative dummy variable “Foreign Dummy” is adopted. “Foreign Dummy” equals one if the company is not headquartered in Singapore or its main business area is not in Singapore. Among all the 181 firm-year observations which Tobin’s Q is available and 184 firm-year observations which ROA is available, 71 and 66 are defined as “Foreign”. This variable is also used to explore the performance of these foreign firms. In this case, fixed effects are then not feasible since there are no within country variations in this variable. La Porta et al. (2002) and Claessens et al. (2002) adopted random effect models.
Further, leverage can play a disciplinary role by limiting the free cash flow at hand, and hence the managers of indebted firms are less able to invest in projects with negative net present values (Jensen, 1986). The Debt Ratio, which is defined as the sum of the book value of short-term and long-term debt over the book value of assets, is controlled for leverage. Other factors such as growth opportunity, firm size, firm age and asset structure may also be controlled. However, considering the limited number of sample observations, they are not considered in this paper. When more data sets from a longer time period are available, more explanatory variables could be studied.
4.1.4. Summary Statistics
The following Table 8 describes the summary statistics of the variables used in the regressions followed.
Table-8. Summary Statistics
| 1 | Number of observations | Mean | Std Dev | Min | Max |
| Tobin's Q | 181 | 1.52 | 0.97 | 0.45 | 6.83 |
| ROA | 184 | 8.0% | 14.4% | -152.0% | 59.3% |
| Debt Ratio | 190 | 54.3% | 20.1% | 4.4% | 111.4% |
| Cash Flow Rights | 192 | 36.3% | 21.4% | 4.2% | 93.1% |
| Control Rights | 192 | 44.7% | 17.0% | 19.0% | 96.3% |
| Dispersion Ratio(*) | 192 | 1.55 | 0.78 | 0.47 | 5.97 |
* If only firms whose cash flow rights are different from control rights are considered, the average dispersion ratio will be 1.95 with a standard deviation of 0.78.
From the above Table 8, we can see that the Tobin’s Q has an average value of 1.52 and a minimum and maximum of 0.45 and 6.83. The accounting measure ROA has a mean value of 8%. The minimum ROA -152% is from the Global Crossing, which was under bankruptcy protection. To include or exclude this extreme data item does not affect the sign of the coefficients and the significance of the regressions results. The mean debt ratio is 54.3%. The maximum item value is 111.4% from Global Crossing in the end of 2005. The average cash flow rights owned by Temasek is 36.3% with a minimum and maximum 4.2% and 96.3%. The minimum control rights are 19%. The average dispersion ratio, which is measured as the ratio of control rights over cash flow rights, is 1.55. It suggests that Temasek as the ultimate owner shares a higher control rights than the corresponding cash flow rights in a large fraction of these companies.
4.2. The Performance of the Firms Controlled by Temasek
In this part, a serious of questions will be discussed including: the performance of Temasek’s investments in foreign countries, and the role of disparity between cash flow rights and control rights resulting from the use of control-enhancing tools.
The econometric model applied in the following regressions is Ordinary Least Squares (OLS) with panel data. Two questions should be discussed.
Firstly, the basic forms of these models assume that the standard errors have the same variance across all observation points. Since the panel data set has multiple observations of the same firm, the standard errors are possible correlated across firms and/or years. Heteroscedasticity-consistent standard errors should be applied (Peterson, 2009). In this paper, the Huber-White standard errors are applied. In regressions, both firm and year are cluster variables. In the regressions based on individual year data, only firm is cluster variable.
Secondly, the implication of small sample size should be explored. The total number of observations is limited and the numbers of observations for each of the five individual years 2004-08 are even much less, ranging from 29 to 39. The relations will tend to be less significant even when the degree of association is unchanged. The pooled OLS results are the main consideration of this paper while the results from individual years are also discussed. In addition, all regressions are carefully conducted to avoid that one or a few data items drive the main results.
4.2.1. The Performance of Temasek’s Investments in Foreign Countries
In this part, the performance of Temasek’s investments in foreign countries is analysed. The foreign country is defined as a country rather than Singapore. The companies which are headquartered in these foreign countries or main business areas are in these foreign countries are defined as foreign companies. In the sample data of this study, these two criteria are consistent. A dummy variable “Foreign Dummy” is setup to describe this. The following Table 9 shows the pooled regression results and yearly results.
Table-9. The Performance of Temasek’s investments in Foreign Countries Dependent Variable: Tobin’s Q
| 2004 | 2005 | 2006 | 2007 | 2008 | Pooled | |
| Intercept | 1.26 | 1.54 | 1.67 | 1.43 | 0.62 | 0.89 |
| (0.003) | (0.0006) | (<.0001) | (<.0001) | (0.0004) | (<.0001) | |
| Foreign Dummy | -0.31 | -0.48 | -0.57 | -0.54 | -0.15 | -0.42 |
| (0.32) | (0.22) | (0.095) | (0.048) | (0.427) | (0.002) | |
| Debt Ratio | 0.53 | 0.57 | 0.48 | 0.88 | 1.01 | 0.74 |
| (0.39) | (0.43) | (0.43) | (0.14) | (0.02) | (0.006) | |
| Year Dummy | No | No | No | No | No | Yes |
| Adjusted R-Sq | 0.025 | 0.044 | 0.068 | 0.129 | 0.158 | 0.115 |
| Number of Observations | 30 | 35 | 37 | 39 | 38 | 179 |
From the above table, we can see that the coefficients of “Foreign Dummy” are always negative and significant for the pooled result and year 2006 and 2007. It shows that Temasek’s investments in foreign countries underperform those based in Singapore. The coefficients of Debt Ratio are always positive although significant for the pooled result and year but insignificant for other years. Year Dummies are included in the pooled OLS regressions.
If a univariate analysis is performed, the results are also consistent. The following Table 10 shows that Tobin’s Q and ROA are significant between foreign companies and non-foreign companies, and the Debt Ratio is also significantly different.
Table-10. T-test for the Means of Variables within Foreign Dummy
| Variable | N | Mean | Std. Dev | T-Statistics | Df | Pr > t |
| Tobin's Q | 71 | 1.29 | 0.53 | 2.90 | 166 | 0.004 |
| ROA | 66 | 4.8% | 0.21 | 1.84 | 76 | 0.070 |
| Debt Ratio | 72 | 57.9% | 0.26 | -1.77 | 103 | 0.080 |
There are two explanations for this result. First, it is quite possible that foreign owners (Temasek) know less about the investees than local owners. Coordinating costs will be high and the conflicts among stakeholders resulting from a clash of cultures are very likely. Second, it is understandable that foreign government-related investments in a host country are always politically sensitive. In terms of Temasek’s case, some of its investments in foreign countries are quite controversial. When Singapore Technologies Telemedia (STT), a subsidiary of Temasek (see Figure 1 for its position in Temasek), took a significant stake in Indonesian Indosat, workers went on strike to protest this deal 19. Although Temasek’s investment was the largest single foreign investment in Indonesia following the Asian financial crisis, which was seen as a demonstration of confidence in the Indonesian economy, and STT paid more than 50% premium over the then prevailing market price, Temasek was forced to sell its major stake in Indosat in 2008 because of legal dispute with the Indonesian government 20. Temasek’s acquisition of Shin Corporation even exacerbated the Thai political crisis and eventually led to the step-down of the Thai Prime Minister. Temasek was even cited by journalist as being central to the Singaporean support for the Burmese military dictatorship 21.
The following Table 11 shows the fraction of block investments in foreign countries/regions in Temasek’s portfolio. The calculation of denominator is based on market value of listed assets and book value of unlisted assets less debt.
If assuming that among the listed block investments (Row 2, Table 11), the fractions of investment in foreign regions are the same as the fractions from the total portfolio (Row 1, Table 11), Row 3 (Table 11) shows the fractions of listed block investments in foreign regions. The results show that that Temasek’s investments in foreign assets including listed and unlisted increase steadily but its listed block investments in foreign assets also decreases steadily from 34.7% in 2004 to only 26.2% in 2008. In my data sets, Temasek owns 33% cash flow rights of Arab Heavy Industries, which is a United Arab Emirates-based listed company. Whether Temasek is the largest shareholder is not sure. This is the only case possibly omitted in the sample data but included in Temasek Annual Reviews’ calculation. It is reasonable to conclude that since Temasek’s listed block investments in foreign regions underperform, Temasek has steadily decreases such kind of investments.
Table-11. The fraction of Portfolio Value from block investments in Foreign Countries/Regions22
| Number of Row | Fractions of Various Categories | 2004 | 2005 | 2006 | 2007 | 2008 |
| 1 | FError! Reference source not found.raction of Investments in Foreign Regions | 51% | 56% | 62% | 67% | 69% |
| 2 | Fraction of Listed Block Investments | 68% | 57% | 52% | 48% | 38% |
| 3 | Fraction of Listed Block Investments in Foreign Regions | 34.7% | 31.9% | 32.2% | 32.2% | 26.2% |
| 4 | Fraction of Unlisted Investment | 14% | 17% | 18% | 21% | 28% |
| 5 | Fraction of listed and liquid assets | 18% | 26% | 30% | 31% | 34% |
| 6 | Fraction of unlisted Investment in Foreign Regions | 7.1% | 9.5% | 11.2% | 14.1% | 19.3% |
Row 5 (Table 11) shows that Temasek’s investments in listed and liquid assets have steadily increased from 18% in 2004 to 34% in 2008, which seems suggesting that Temasek is beginning to adopt the portfolio investment strategy. Row 4 (Table 11) also shows that Temasek has increased its investments in unlisted assets greatly. The 2008 figure of 28% is double of what it was in 2004. If assuming that the fractions of investments in foreign regions are the same as the figures based on total portfolio value, the fraction of unlisted Investment in foreign regions (Row 6, Table 11) has even increased greater. The 2008 figure of 19.3% is 2.7 times of 2004 figure. This phenomenon may be related to the underperformance of Temasek’s listed block investments in foreign regions.
4.2.2. The Effect of the Disparity between Cash Flow Rights and Control Rights
The difference between control rights and cash flow rights are as a proxy for the entrenchment effect. The hypothesis is that the higher the dispersion, defined as the ratio between control rights and cash flow rights, the lower the corporate valuation.
The following Table 12 shows the role of the disparity between control rights and cash flow rights in corporate valuation. In the pooled regression 1, all firm-year observations, which have same and different control rights from cash flow rights, are included in the sample data. The country dummy variables are nine country dummies. Only Country 1, which is defined as being equal 1 if the company is based in Singapore, is reported. In the pooled regression 2, only firm-year observations, which have different control rights from cash flow rights, are included in the sample data. Since there are fewer data sets, the Foreign Dummy rather than nine country dummy variables is included. In the individual year regressions, the country dummy is Foreign Dummy.
The Table 12 shows that whether including or excluding the firm-year observations with same control rights to cash flow rights, the coefficients of Dispersion are both significantly negative (within 1% and 10% confidence level respectively). It demonstrates that one standard deviation increase in the disparity, Tobin’s Q will be lowered 0.32 standard deviation. Considering that even only the mechanism of pyramiding is considered in calculating disparity, 100 of 179 firm-year observations are sharing a disparity between cash flow rights and control rights. If other mechanisms including Golden Shares and so on are also included, the problem will be more serious. The minority shareholders are detrimental to the wide adoption of the control-enhancing tools. The coefficients of Debt Ratio are positively significant suggesting a positive role of debt in corporate valuation. Country Dummies also significantly perform as predicted.
Table-12. The Role of the Disparity between Cash Flow Rights and Control Rights (Dependent Variable: Tobin’s Q)
| Years | Pooled 1 | Pooled 2 | |||||
| 2004 | 2005 | 2006 | 2007 | 2008 | |||
| Intercept | 1.87 | 1.85 | 1.91 | 1.70 | 0.82 | -0.09 | 0.91 |
| (0.027) | (0.040) | (0.005) | (0.0005) | (0.003) | (0.845) | (0.0005) | |
| Dispersion | -0.29 | -0.14 | -0.12 | -0.13 | -0.10 | -0.32 | -0.14 |
| (0.238) | (0.596) | (0.56) | (0.373) | (0.195) | (<.0001) | (0.07) | |
| Debt Ratio | 0.06 | 0.32 | 0.36 | 0.75 | 0.94 | 1.21 | 1.20 |
| (0.943) | (0.749) | (0.606) | (0.223) | (0.038) | (0.009) | (0.001) | |
| Year Dummy | No | No | No | No | No | Yes | Yes |
| Country Dummy | -0.21 | -0.40 | -0.53 | -0.53 | -0.14 | 1.19 | -0.29 |
| (0.489) | (0.315) | (0.104) | (0.053) | (0.449) | (0.0003) | (0.053) | |
| Adjusted R-Sq | 0.050 | 0.049 | 0.073 | 0.141 | 0.176 | 0.212 | 0.253 |
| Number of Observations | 30 | 35 | 37 | 39 | 38 | 179 | 100 |
In terms of the five individual year regressions, the coefficients of Disparity are all negative although insignificant. Debt Ratio also plays a positive role in corporate valuation (significantly in year 2008 and insignificantly in other years). Temasek’s investments in foreign countries consistently underperform the investments located in Singapore.
5. POLITICAL CONSIDERATIONS OR PURE ECONOMIC GOAL?
The objective of Temasek is to maximize the wealth created defined as the total return minus the minimum required return as it said “maximise the long-term shareholder value” (Temasek 2006 Annual Review: 10). The total return is calculated as the change of the market value of the portfolio plus dividends, adjusted for net new capital received by Temasek. The minimum required return is defined as a cost of equity return on the market value of the portfolio at the start of the year. Temasek frequently uses the Total Shareholder Return (TSR), defined as the compounded annual return over the specified period, as the performance indicator. The 40-year TSR since inception (1974) by market value is 15%.
Temasek’s listed block investments in non-Singapore regions have consistently underperformed those based in Singapore during 2004-08. If Temasek’s goal is to maximize the shareholder value, Temasek should allocate more block investments in Singapore. As Table 11 shows that the fraction of listed block investments in non-Singapore regions has steadily decreased, we can conclude that if there were any non-economical (political) considerations, these considerations have become weaker rather than stronger. In fact, Temasek has downplayed its links to government policy or strategic interests in 2009 through the launch of its new charter. In “Temasek Charter 2002”, it said that “Temasek Holdings holds and manages the Singapore Government’s investments in companies, for the long term benefit of Singapore”. In the “Temasek Charter 2009”, this statement “for the benefit of Singapore” has been changed to “for our stakeholders”. 2009 Charter also claimed that “Temasek Holdings is an investment company managed on commercial principles”. The statement of “Temasek will help to broaden and deepen Singapore’s economic base” in 2002 Charter was gone in 2009.
6. CONCLUSIONS
SWFs have attracted attentions of financial markets and policy-makers for a while. A limited number of studies try to define this new type of investment fund. Some of these studies also show that SWF’s long-run performance tends to be poor. Unlike previous studies, this paper looks deep into one particular SWF – Singapore’s Temasek Holdings, especially of the control mechanisms of Temasek and the performance of the firms controlled by Temasek.
The significance of this study includes a few aspects. First, Temasek plays a dominant role in SGX and Singaporean economy. Second, Temasek is one of the largest and most transparent SWFs around the world. Third, Temasek is one of the very few SWFs which adopt a concentrated investment strategy. This study on Temasek provides unique and insightful viewpoints from multiple angles.
This paper’s study on how Temasek controls its investments shows that Temasek adopts a series of control-enhancing tools. They include: in absolute control, pyramiding structure, golden shares, increasing control of parent company, influence on a third party and use of nominees. While these tools are not mutual exclusive, they do help create a disparity between cash flow rights and control rights. Further empirical results show that this dispersion is harmful to small shareholders.
This paper also finds that Temasek’s listed block investments in non-Singapore regions have consistently underperformed those based in Singapore during 2004-08. During the same period, the fraction of Temasek’s listed block investments in non-Singapore regions has steadily decreased. It seems that if there were any non-economical (political) considerations, these considerations have become weaker rather than stronger.
This study is based on hand-collected panel data during 2004-08. Further study can be expanded to the more recent period. While data-collection process is time-consuming, the outcome would be fruitful. For example, does Temasek change its control and investment strategies because of the Global Financial Crisis (GFC)? Does the post-GFC period differ?
| Funding: This study received no specific financial support. |
| Competing Interests: The author declares that there are no conflicts of interests regarding the publication of this paper. |
REFERENCES
Anga, J.S. and D.K. King, 2006. Government ownership and the performance of government-linked companies: The case of Singapore. Journal of Multinational Financial Management, 16(1): 64-88.
Balding, C.A., 2008. Portfolio analysis of sovereign wealth funds. Retrieved from SSRN: http://ssrn.com/abstract=1141531 or http://dx.doi.org/10.2139/ssrn.1141531.
Blundell-Wignall, A., Y. Hu and J. Yermo, 2008. Sovereign wealth and pension fund issues. OECD Working Papers on Insurance and Private Pensions, No. 14, OECD Publishing. DOI 10.1787/243287223503.
Chhaochharia, V. and L. Laeven, 2008. Sovereign wealth funds: Their investment strategies and performance (September). CEPR Discussion Paper No. DP6959. Retrieved from http://ssrn.com/abstract=1308030.
Claessens, S., D. Simeon, J.P.H. Fan and L.H.P. Lang, 2002. Disentangling the incentive and entrenchment effects of large shareholdings. Journal of Finance, 57(6): 2741-2771.
Demsetz, H. and B. Villalonga, 2001. Ownership structure and corporate performance. Journal of Corporate Finance, 7(3): 209–233.
Devlin, W. and B. Brummitt, 2007. A few sovereigns more: the rise of sovereign wealth funds. Economic Roundup Spring, Treasury of Australia, December 18. Retrieved from http://archive.treasury.gov.au/documents/1329/PDF/07_A_few_sovereigns_more_the_rise_of_sovereign_wealth_funds.pdf.
Faccio, M. and L.H.P. Lang, 2002. The ultimate ownership in Western European corporations. Journal of Financial Economics, 65(3): 365-395.
Heaney, R., L. Li and V. Valencia, 2011. Sovereign wealth fund investment decisions: Temasek holdings. Australian Journal of Management, 36(1): 109-120.
Jen, S., 2007. How big could sovereign wealth funds be by 2015? Morgan Stanley Research, May 3.
Jensen, M.C., 1986. Agency costs of free cash flow, corporate finance and takeovers. American Economic Review, 76(2): 323-329.
La Porta, R., F. Lopez-De-Silanes, A. Shleifer and R. Vishny, 2002. Investor protection and corporate valuation. Journal of Finance, 57(3): 1147–1170.
Peterson, M., 2009. Estimating standard errors in finance panel data sets: Comparing approaches. Review of Finance Studies, 22(1): 435-480.
Veljko, F., B. Bernardo and W. Megginson, 2008. The financial impact of sovereign wealth funds investments in listed companies. Working Paper, University of Oklahoma. Retrieved from https://www.econ.berkeley.edu/sites/default/files/richard_schimbor_thesis.pdf.
| Views and opinions expressed in this article are the views and opinions of the author(s), Asian Economic and Financial Review shall not be responsible or answerable for any loss, damage or liability etc. caused in relation to/arising out of the use of the content. |
Footenotes:
1. For example, in November 2007, the Abu Dhabi Investment Authority announced a deal to buy a 4.9 percent stake in Citigroup for $7.5 billion. In December 2007, China Investment Corporation invested $5 billion in Morgan Stanley for possible 9.9% stake (after the convertible bonds exercised). In December 2007, Singaporean Temasek Holdings bought $4.4 billion of Merrill Lynch common stock with an option to buy $600 million more by March 28, 2008. In December 2007, the Government of Singapore Investment Corp bought 9% in UBS for nearly $10 billion.
2. FY2004 refers to financial year ended 31 Mar 2005 or 31 Dec 2004, depending on the respective financial year ends. Similarly for FY2005, FY2006, FY2007, FY2008
3. According to FTSE classification (2009) besides Singapore, other 24 developed markets are: Australia, Austria, Belgium/Luxembourg, Canada, Denmark, Finland, France, Germany, Greece, Hong Kong, Ireland, Israel, Italy, Japan, Netherlands, New Zealand, Norway, Portugal, South Korea, Spain, Sweden, Switzerland, UK and USA
5. “Concern about 'sovereign wealth funds' spreads to Washington” New York Times, August 20, 2007. Available at: http://www.nytimes.com/2007/08/20/business/worldbusiness/20iht-wealth.4.7186699.html?_r=0. Accessed on July 15, 2016
6. “Wealth Fund Code of Conduct Proposed” Feb 25, 2008, Financial Times Available at: https://next.ft.com/content/8e027d76-e175-11dc-a302-0000779fd2ac. Accessed on July 15, 2016
7. Source: CIC FY2008 Annual Report
8. The reason why this figure is not a like a “pyramid” is because this “pyramid” would be too big to be fitted in one page; This pyramiding structures for FY 2005-2008 are also available upon request; Although Mobile 1 is the equally largest shareholder of Singapore Press Holdings, Mobile 1 is not included in Table 1 which describes the block investments of Temasek. The reason is it is difficult to determine Temasek’s control rights.
10. “Lee Kuan Yew: Baring knuckles” 11 Jan 2004. Available at: http://www.singapore-window.org/sw04/040111st.htm. Accessed on July 15, 2016
11. "SIA could lag as challengers rise". The Taipei Times, 15 Jan 2004. Available at: http://www.taipeitimes.com/News/worldbiz/archives/2004/01/15/2003087724. Accessed on July 15, 2016
12. Temasek Annual Review 2005:42.
13. Overseas-Chinese Banking Corp (OCBC) directly holds 16.8% shares of SPH and Great Eastern life Insurance holds 22.6%, which 81% shares are held by OCBC. The overall cash flow rights held by OCBC is then 35% (=16.8%+22.6%*81%).
16. For a detailed summary and further reading materials (Thai and English), refer to http://en.wikipedia.org/wiki/Thaksin_Shinawatra_$1.88_billion_deal_controversy
18. “Arrest warrant for Surin Upatkoon in Kularb Kaew case” Bangkok Post, 9 October, 2007, http://www.bangkokpost.com/education/site2007/inoc0907.htm (this link becomes invalid in 2016. Further references can be made from “Nominee case casts spotlight on Thailand's investment law” Financial Times, 5 October, 2007. Available at: http://www.ft.com/cms/s/0/52c11292-72dd-11dc-b7ff-0000779fd2ac.html?ft_site=falcon&desktop=true. Accessed on July 15, 2016 and “Thailand: Warrant for Surin's arrest approved” Available at: http://web.international.ucla.edu/institute/article/78685. Accessed on July 15, 2016
20. “ST Telemedia Exits Indonesia with Sale” Wall Street Journal, June 9, 2008. Available at: http://www.wsj.com/articles/SB121292078493855181. Accessed on July 15, 2016
21. “Web of Cash, Power and Cronies” The Age, 28 September 2007. Available at: http://www.theage.com.au/news/world/web-of-cash-power-and-cronies/2007/09/28/1190486569946.html?page=2. Accessed on July 15, 2016
22. Rows 1, 2, 4 and 5 are from Temasek 2005, 2006, 2007, 2008 and 2009 Annual Reviews. Row 4 is assumed to be equal Row1*Row2. Row6 is assumed to be equal Row1*Row4.