


USING HEAD MEASUREMENT STANDARD TO EVALUATE THE BODY PROPORTION OF ETHIOPIAN WOMEN: A CASE STUDY OF BAHIR DAR UNIVERSITY STUDENTS

1,2,3Ethiopian Institute of Textile and Fashion Technology Bahir Dar University, Ethiopia
ABSTRACT
The purpose of this study is to employ head height as a measuring device to compare body proportions using conventional standards on Ethiopian women. The Representative samples were 450 female students aged 18-25 years from four regions of Ethiopia (Tigray, Oromya, Amhara and Southern Nations Nationalities and Peoples region) who are studying at Bahir Dar University. The data was collected by measuring the length of body parts from head to 7 selected different body levels (tip of chine, bust level, waist level, crotch, knee and foot). Finally, the collected data was analyzed through correlation, t-test and ANOVA analysis methods. The result showed that there is no significant difference on the proportionality of head to crotch by head, for each region which means it is possible to use the same standard measurement for all regions; on the other hand there is a significant difference between the proportionality of body measurements of each group. Especially the Amhara region female students’ body structure is different from the others in all the six variables.
© 2017 AESS Publications. All Rights Reserved.
Keywords: Dynamic markets, Bust level, Waist level.
Article History: Received: 6 March 2017, Revised: 4 April 2017, Accepted: 12 April 2017, Published: 25 April 2017
Contribution/ Originality: This study contributes in the existing literature by examining the body proportions of Ethiopian Women Using conventional standards. Proportions of the human bodies are the bottom line to an effective sizing system to better fitting apparel items. Which is important due to the lack of researches on problems of fit in ready-made apparel products.
1. INTRODUCTION
There are subtle differences between individuals, human proportions fit within a fairly standard range, though artists have historically tried to create idealized standards, which have varied considerably over different periods and regions. In modern figure drawing, the basic unit of measurement is the head, which is the distance from w3wethe top of the head to the chin. This unit of measurement is reasonably standard, and has long been used by artists to establish the proportions of the human figure. According to Helen [1] an average person is generally 7.5 heads tall (including the head ).
Women's bodies occur in a range of shapes. Female figures are typically narrower at the waist than at the bust and hips. The bust, waist, and hips are called inflection points, and the ratios of their circumferences are used to define basic body shapes. Female body shapes are the cumulative product of a woman's skeletal structure and the quantity and distribution of muscle and fat on the body. As with most physical traits, there is a wide range of normality of female body shapes. Attention has been focused on the female body as a source of aesthetic pleasure in most human societies. There are, and have been, wide differences in what should be considered an ideal or preferred body shape, both for attractiveness, health reasons and ergonomic endeavors.
Today’s manufacturers place their products on highly competitive and dynamic markets. Dissatisfaction with fit is one of the most frequently stated problems with garment purchases for women. The problem of fit in ready-made apparel has gained a lot of attention as consumer demand for well-fitted apparel has increased. Women have been reported as the most dissatisfied consumers [2]. As a result of this phenomenon, mass-customization establishments have emerged, which have been facilitated by the use of body scanners in developed countries and is slowly coming into selected Africa countries as the scanners have become more affordable to them. Through body-scan technology, body dimensions and shapes are easily and rapidly extracted from a population and converted immediately into body shape categories, size charts and patterns for garment production [3-5]. Up-dated and current population measurements are therefore vital in most countries, to minimize fitting problems related to ready-made apparel.
Proportions of the human body are the bottom line to an effective sizing system and subsequently to better fitting apparel items. Sizing systems originate from people’s measurements and body shapes . The body shape is three-dimensional, the measurements obtained from it, therefore, must be accurately taken and representative of the body’s characteristics that are critical to apparel’s fit. The measurements and the varied body shapes can only be accurate, consistent and representative if they are taken accurately, by correct methods, instruments and appropriate techniques employed [5-7].
1.1. Statement of the Problem
Female body shapes and proportions vary and change over time, as the result of, amongst others, nutritional changes, lifestyles and ethnicity [3, 6]. Ethnicity is a key variable in Ethiopia, which is situated on the horn of Africa bordering Sudan, Uganda, Kenya, Djibuti Somalia, Eritrea and Yemen. The country is divided into 9 regions as shown on the map as in Fig. 1. The nations surrounding Ethiopia spill over into its borders, giving the country a racial ad-mixture that makes the genotype and phenotype of its population very diverse. The Regions that border Sudan and Kenya have Black African features, while, regions bordering Eritrea Yemen, and Somalia have Asiatic and, Arabic phenotypes. For the sake of having a reference point for discussion, the differences will be examined based on the impact they have on the fit of the constructed apparel, be it ready-made or custom-made.
It has been established that ready-made apparel depend on an accurate estimate of the distribution of body shapes and sizes within a target population, it becomes necessary for every country, and even regions within countries, to establish their own sizing systems based on the target population [5].
Although a considerable body of sizing and fit re-search has already been done, most of the research has been done in first-world countries. In many cases the sizing systems from such studies are used to make well-fitting clothes. These clothes are manufactured and distributed in third-world countries, so the women end up with clothes made to fit a totally different set of body dimensions and proportions. The Third-World country’s consumers then have to make a decent choice based on a faulty foundation. African developing countries such as Ethiopia, and others, face severe apparel-fit problems.
The question for this research is thus: What are the distinctive body proportions of Ethiopian women’s bodies?
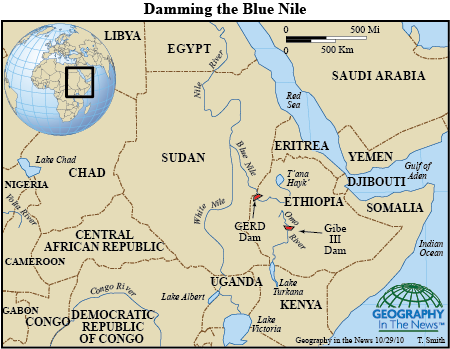
Figure-1. The Ethiopian neighbor 1
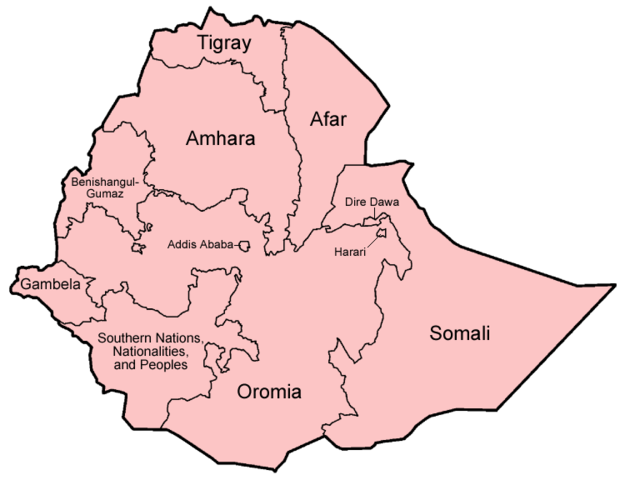
Figure-2. The Regions of Ethiopian2
1.2. Scope of the Study
Though this study is set to study Ethiopian women, the subjects was limited to a sample taken at the 5 campuses of Bahir Dar University due to time and budget constraints. This could be viewed as a pilot study that could aid in perfecting the survey techniques and practices for a country-wide survey in the future. The only option for obtaining measurements for the purposes of body-shape identification was traditional anthropometry.
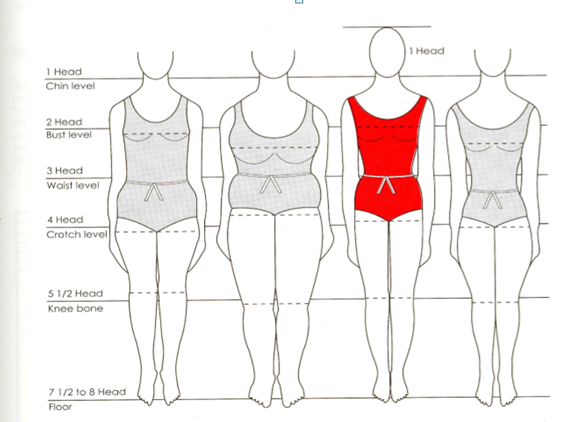
Figure-3. The standard body proportionality of females with the head length:
Source: Helen [1]
2. RESULTS AND DISCUSSION
Table-1. Sample Populations
| Region | |||||
| Freq. | Percent | Valid Percent | Cumulative Percent | ||
| Valid | Tigray | 97 | 21.9 | 21.9 | 21.9 |
| Oromya | 2 | 20.8 | 20.8 | 42.7 | |
| Amhara | 168 | 37.9 | 37.9 | 80.6 | |
| Southern nations | 86 | 19.4 | 19.4 | 100.0 | |
| Total | 443 | 100.0 | 100.0 | ||
Table-2. T test for five important variables for Garments
| One-Sample Test | |||||||||
| Test value | Mean | SD | t | Df | Sig. (2-tailed | MD | 95% C.I of the Difference | ||
| Lower | Upper | ||||||||
| The ratio of head to bust level by head | 2 | 2.3644 | 0.2656 | 28.749 | 438 | .0001 | 0.36444 | 0.36444 | 0.3894 |
| The ratio of head to waist level by head | 3 | 2.8848 | 0.39947 | -6.040 | 438 | .0001 | -.11515 | -.1526 | -.0777 |
| The ratio of head to crotch level by head | 4 | 4.0324 | 0.39947 | 1.280 | 438 | .2010 | .03238 | -.0173 | .0821 |
| The ratio of head to knee level by head | 5.5 | 5.7822 | .74972 | 7.887 | 438 | .0001 | .28221 | .2119 | .3525 |
| The ratio of total height by head | 7.5 | 7.8988 | .87406 | 9.560 | 438 | .0001 | .39880 | .3168 | .4808 |
Out of the 5 variables the ratio of head to crotch level by head can be used for the same body standard chart for all the four regions based on the standard body measurement. For the other measurements there is a significant difference with the respective standard value. So ANOVA method was used to check whether there is a significant difference or not among the regions.
Table-3. ANOVA test
| ANOVA | |||||||
| Sum of Squares | df | M. Square | F | Sig. | |||
| The ratio of head to bust level by head | Between Groups | 2.407 | 3 | 0.802 | 12.252 | .001 | |
| Within Groups | 28.491 | 435 | 0.065 | ||||
| Total | 30.899 | 438 | |||||
| The ratio of head to waist level by head | Between Groups | 4.138 | 3 | 1.379 | 9.125 | .001 | |
| Within Groups | 65.758 | 435 | .151 | ||||
| Total | 69.896 | 438 | |||||
| The ratio of head to knee level by head | Between Groups | 11.499 | 3 | 3.833 | 7.104 | .001 | |
| Within Groups | 234.694 | 435 | .540 | ||||
| Total | 246.193 | 438 | |||||
| The ratio of total height by head | Between Groups | 18.568 | 3 | 6.189 | 8.519 | .001 | |
| Within Groups | 316.054 | 435 | .727 | ||||
| Total | 334.622 | 438 | |||||
From table 3 above the ANOVA test shows all the four variables with the value of p < 0.05, which means there is a significant difference between the groups as a whole. On the next table 4, the post hoc test was used to show how each region differed from another on each of the four variables.
In table 4 above Post hoc test for the first variable (the ratio of head to bust level by head) for the regions Tigray & Amhara, Oromya & Amhara and Southern Nations & Amhara region in all cases p < 0.05 , and the confidence of interval (CI) does not include (-0.0624, 0.2307) , (0.0025,0.01763) and (- 0.2705, -0.0954) respectively.
In general Amhara region female students’ body ratio is different from all the three regions Tigray, Oromya and Southern Nations.
Table-4. Post hoc test result
| Multiple Comparisons | |||||||
| Tukey HSD | |||||||
| Dependent Variable | (I) Region | (J) Region | Mean Difference (I-J) | Std. Error | Sig. | 95% Confidence Interval | |
| L. Bound | U.Bound | ||||||
| The ratio of head to bust level by head | Tigray | Oromya | .05714 | .03768 | .428 | -.0400 | .1543 |
| Amhara | .14655* | .03264 | .0001 | .0624 | .2307 | ||
| Southern nations | -.03640 | .03791 | .7720 | -.1342 | .0614 | ||
| Oromya | Amhara | .08940* | .03368 | .0410 | .0025 | .1763 | |
| Southern nations | -.09354 | .03881 | .0770 | -.1936 | .0065 | ||
| Amhara | Southern nations | -.18294* | .03393 | .0001 | -.2705 | -.0954 | |
| The ratio of head to waist level by head | Tigray | Oromya | .10143 | .05658 | .2780 | -.0445 | .2474 |
| Amhara | .23755* | .04980 | .0001 | .1091 | .3660 | ||
| Southern nations | .04820 | .05759 | .8370 | -.1003 | .1967 | ||
| Oromya | Amhara | .13613* | .05064 | .0370 | .0055 | .2667 | |
| Southern nations | -.05323 | .05832 | .7980 | -.2036 | .0972 | ||
| Amhara | Southern nations | -.18936* | .05176 | .0020 | -.3229 | -.0559 | |
| the ratio of head to knee level by head | Tigray | Oromya | .16367 | .10690 | .4200 | -.1120 | .4394 |
| Amhara | .37519* | .09408 | .0001 | .1325 | .6178 | ||
| Southern nations | .02434 | .10879 | .9960 | -.2562 | .3049 | ||
| Oromya | Amhara | .21152 | .09568 | .1220 | -.0352 | .4583 | |
| Southern nations | -.13933 | .11017 | .5860 | -.4235 | .1448 | ||
| Amhara | Southern nations | -.35085* | .09779 | .0020 | -.6031 | -.0986 | |
| the ratio of total height by head | Tigray | Oromya | .27076 | .12405 | .1300 | -.0492 | .5907 |
| Amhara | .51043* | .10918 | .0001 | .2288 | .7920 | ||
| Southern nations | .11688 | .12625 | .7910 | -.2087 | .4425 | ||
| Oromya | Amhara | .23966 | .11103 | .1370 | -.0467 | .5260 | |
| Southern nations | -.15388 | .12785 | .6250 | -.4836 | .1758 | ||
| Amhara | Southern nations | -.39355* | .11348 | .0030 | -.6862 | -.1009 | |
*. The mean difference is significant at the 0.05 level.
3. CONCLUSION
The result showed that there is no significant difference on the proportionality of head to crotch by head for each region which means it is possible to use the same standard measurement for all regions. On the other hand, there is a significant difference between the body measurements proportionality of each group; especially, the Amhara region female students’ proportionality from different body parts to their head height is different from the other three regions in all the six variables. It will be approved by further researches whether the difference is related to African ethnic groups of Sematic, Cushitic and Omotic.
| Funding: The authors would like to thank Ethiopian Institute of Textile and Fashion Technology for fully funding this research. |
| Competing Interests: The authors declare that they have no competing interests. |
| Contributors/Acknowledgement: All authors contributed equally to the conception and design of the study. |
REFERENCES
[1] A. J. Helen, Pattern making for fashion design, 4th ed. New Jersey: Pearson Education, Inc, 2006.
[2] R. Otieno, "Approaches in researching human measurement MMU model of utilizing anthropometric data to create size charts," EuroMed Journal of Business, vol. 3, pp. 63-82, 2008. View at Google Scholar | View at Publisher
[3] S. Ashdown, "An investigation of the structure of sizing systems. A comparison of three multidimensional optimized sizing systems generated from anthropometric data with the ASTM standard D5585-94," International Journal of Clothing Science and Technology, vol. 10, pp. 324-341, 1998. View at Google Scholar
[4] S. Ashdown, S. Loker, and C. Adelson, "Improved apparel sizing: Fit and anthropometric 3-D scan data (Issue Brief NTC Project: S04-CR01)," 2005.
[5] K. Simmons, C. L. Istook, and P. Devarajan, "Female figure identification technique (FFIT) for apparel part II: Development of shape sorting software," Journal of Textile and Apparel, Technology and Management, vol. 4, pp. 1-16, 2004.
[6] J. M. Winks, Clothing sizes: International standardization. Manchester: Textile Institute, 1997.
[7] S. Ashdown, S. Loker, and C. Adelson, "Improved apparel sizing: Fit and anthropometric 3-D scan data," National Textile Center Annual Report 2007, 2007.
BIBLIOGRAPHY
[1] S. P. Ashdown and L. Dunne, "A study of automated custom fit: Readiness of the technology for the apparel industry," Clothing and Textiles Research Journal, vol. 24, pp. 206-136, 2006. View at Google Scholar | View at Publisher
[2] E. Bye, K. L. LaBat, and M. R. Delong, "Analysis of body measurement systems for apparel," Clothing and Textiles Research Journal, vol. 24, pp. 66-79, 2006. View at Google Scholar | View at Publisher
| Views and opinions expressed in this article are the views and opinions of the author(s), Journal of Asian Scientific Research shall not be responsible or answerable for any loss, damage or liability etc. caused in relation to/arising out of the use of the content. |